At Skli.ai, we don't just provide answers, we build understanding by making complex knowledge digestible and personalized.
Skli.ai uniquely excels in the Research and Understanding Phase of knowledge work—where other AI systems merely generate content, we specialize in breaking down complex information into structured, comprehensible formats. Our platform transforms uploaded texts and videos into customized learning resources: comprehensive summaries, intuitive mind maps, targeted flashcards, organized learning notes, and relevant study questions.
This is a short extract of the project that was completed as part of my data analytics studies at Turing College, Sprint 5: Visualizing Data using Power BI.
Project Overview
This project plugged us as students into the shoes of a professional Data Analyst working in a corporate environment. We were tasked with creating real-world business solutions that would directly impact decision-making processes.
This article documents the development of an interactive sales dashboard for AdventureWorks' Sales Director. The dashboard transforms static sales data into dynamic visualizations that provide actionable insights into company performance across different sales channels and geographical markets. By simulating the responsibilities of a Data Analyst, the project offered valuable experience in translating business requirements into technical solutions, connecting to enterprise databases, and designing visualizations with the end-user's needs at the forefront.
Methodology
Data Source Selection
The project utilized the AdventureWorks database hosted on Google BigQuery, with a primary focus on the salesorderheader table. Data extraction was performed using SQL queries to optimize performance and data relevancy.
Key Performance Indicators
Four primary KPIs were established to provide an immediate overview of business performance:
- Orders Count: = COUNTROWS('Sales') or = COUNT('Sales'[SalesOrderID])
- Total Sales ($): = SUM('Sales'[TotalDue])
- Average Order Value (AOV): = SUM('Sales'[TotalDue]) / COUNT('Sales'[SalesOrderID])
- Average Days to Ship: = AVERAGEX('Sales', DATEDIFF('Sales'[OrderDate], 'Sales'[ShipDate], DAY))
Data Visualization Implementation
The dashboard was constructed in three sequential phases:
Phase 1: KPI Visualization Created summary metrics prominently displayed at the top of the dashboard with appropriate formatting to ensure immediate visibility.
Phase 2: Time-Series Analysis Implemented two complementary visualizations:
- Monthly sales by year/month to identify seasonal patterns: = CALCULATE(SUM('Sales'[TotalDue]), DATESBETWEEN('Date'[Date], STARTOFMONTH('Date'[Date]), ENDOFMONTH('Date'[Date])))
- Year-over-year monthly comparisons to highlight growth trajectories: = VAR CurrentYearSales = CALCULATE(SUM('Sales'[TotalDue]), SAMEPERIODLASTYEAR('Date'[Date])) RETURN DIVIDE(SUM('Sales'[TotalDue]) - CurrentYearSales, CurrentYearSales, 0)
Phase 3: Sales Channel Analysis Added a derived "Sales Type" column using the formula: = Table.AddColumn(salesorderheader_Table, "Sales Type", each if [SalesPersonID] > 0 then "Offline" else "Online")
This enabled visualization of performance across online and offline sales channels.
Technical Implementation
Data Connection
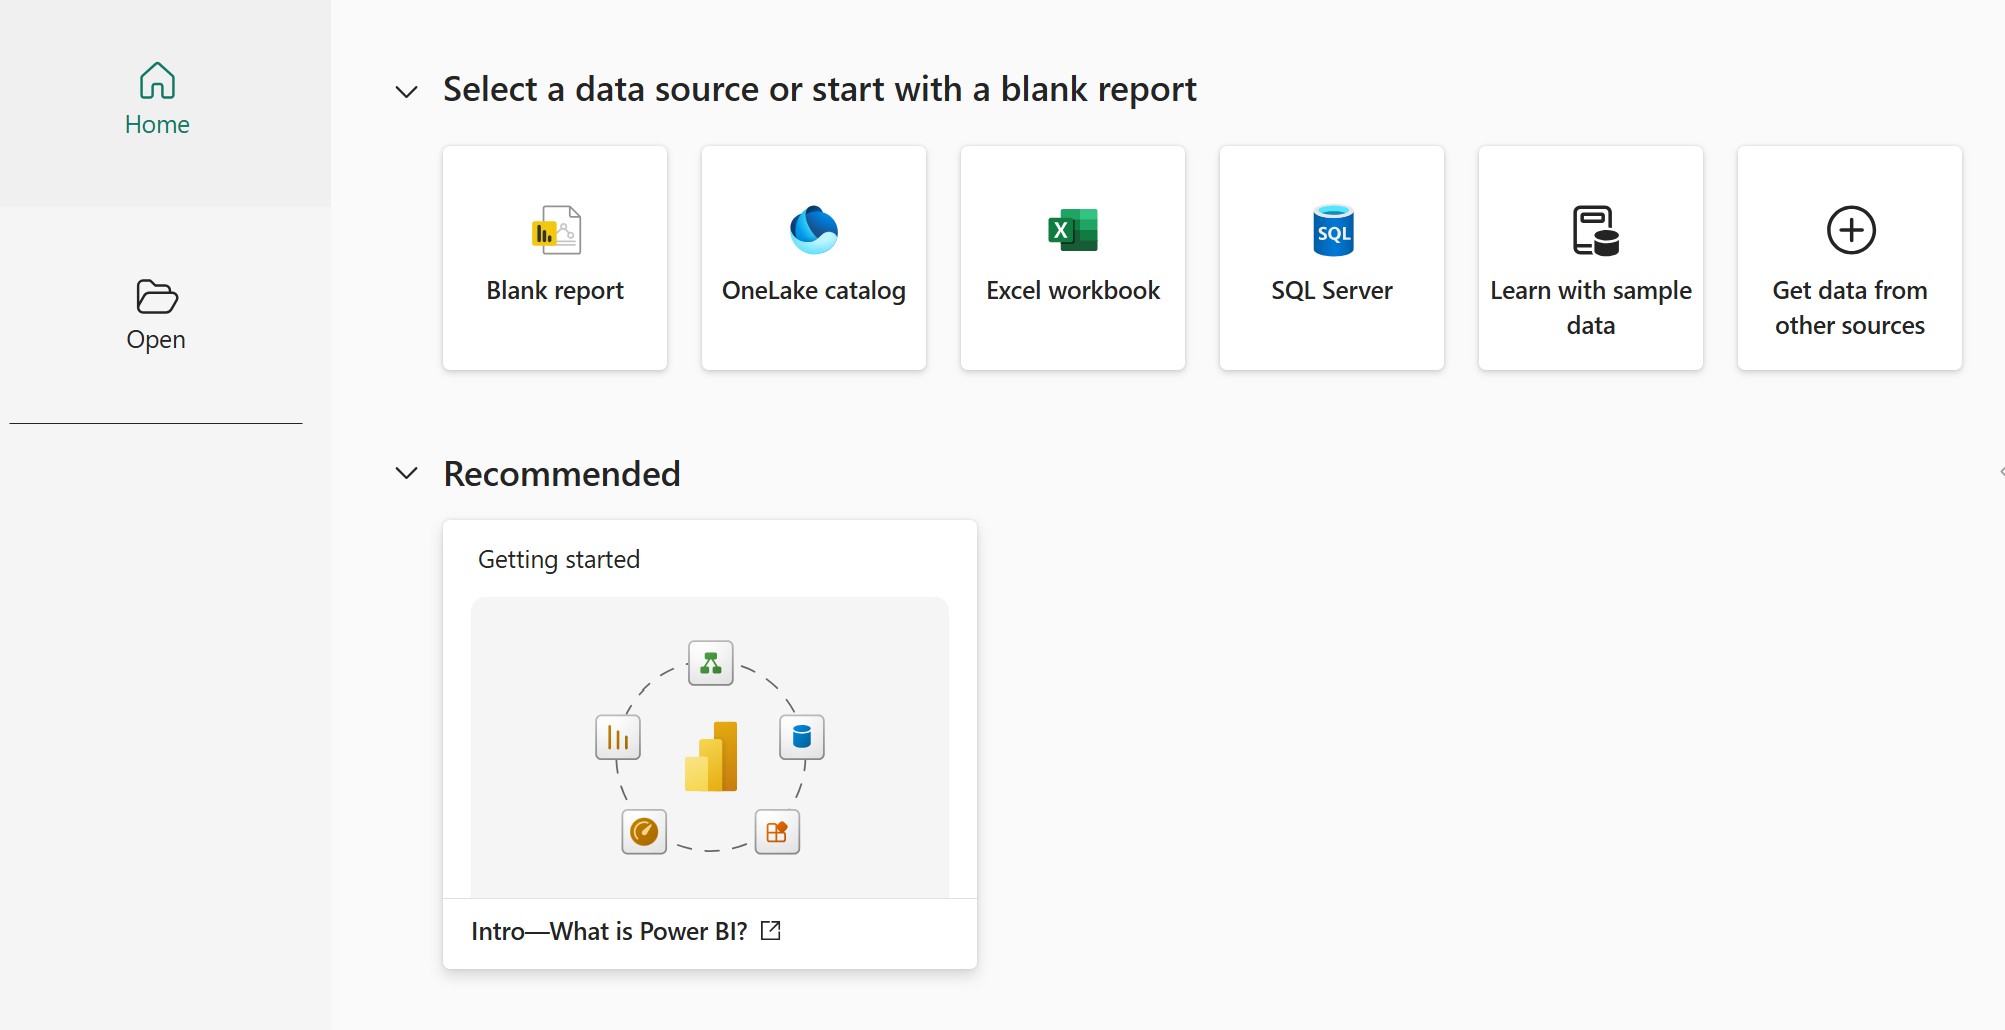
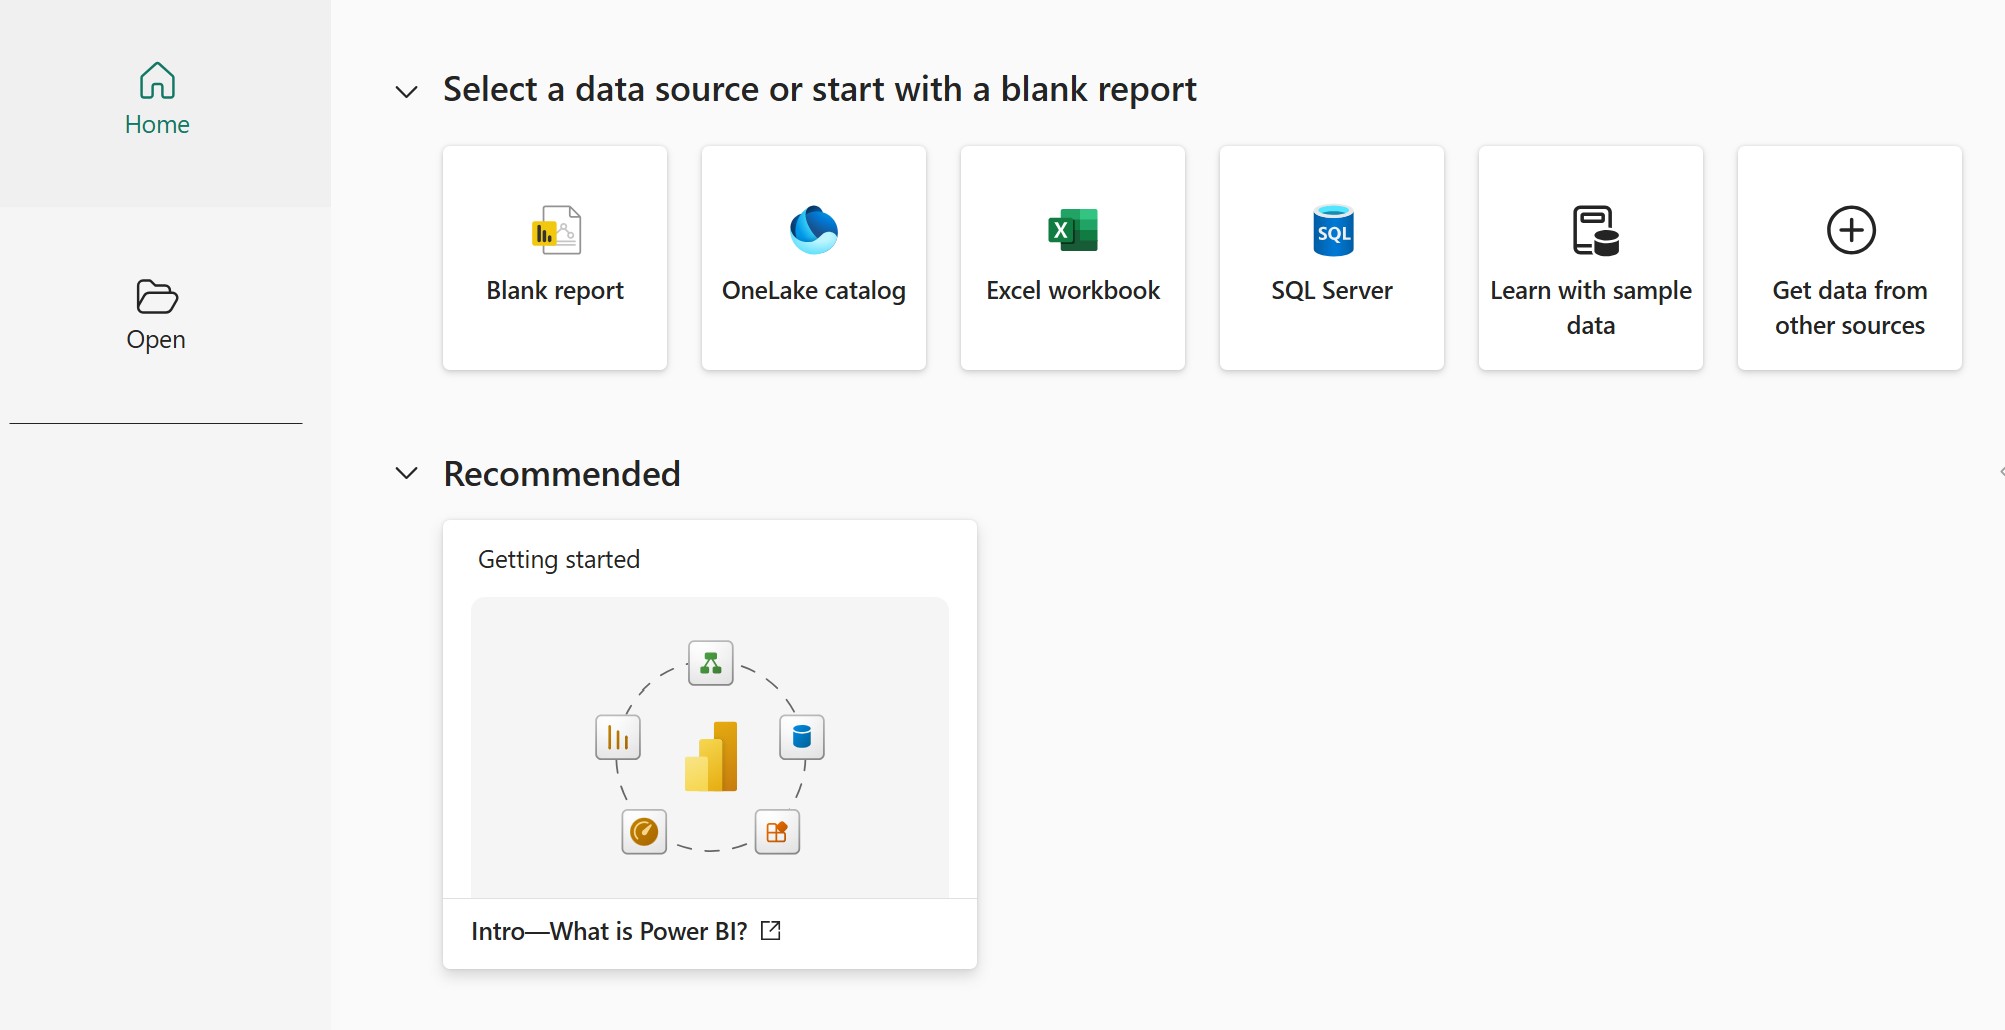
Established a secure connection to Google BigQuery using Power BI's native connector. Implemented custom SQL queries to extract precisely the data required for dashboard creation.
Custom Calculations
Utilized Data Analysis Expressions (DAX) to create calculated metrics for Average Order Value and Average Days to Ship, ensuring proper context and accurate aggregation.
Data Transformation
Performed necessary transformations within Power BI's Query Editor, including the addition of the Sales Type classification based on SalesPersonID values.
Design Principles
The dashboard design was guided by these core principles:
- Information Hierarchy: Critical KPIs positioned prominently for immediate recognition
- Interactive Analysis: Date range filters implemented to facilitate temporal exploration
- Visual Clarity: Appropriate chart types selected based on data relationship types
- Design Consistency: Uniform color scheme and formatting applied throughout
- Performance Optimization: Dashboard configured for responsive user interaction
Results and Insights
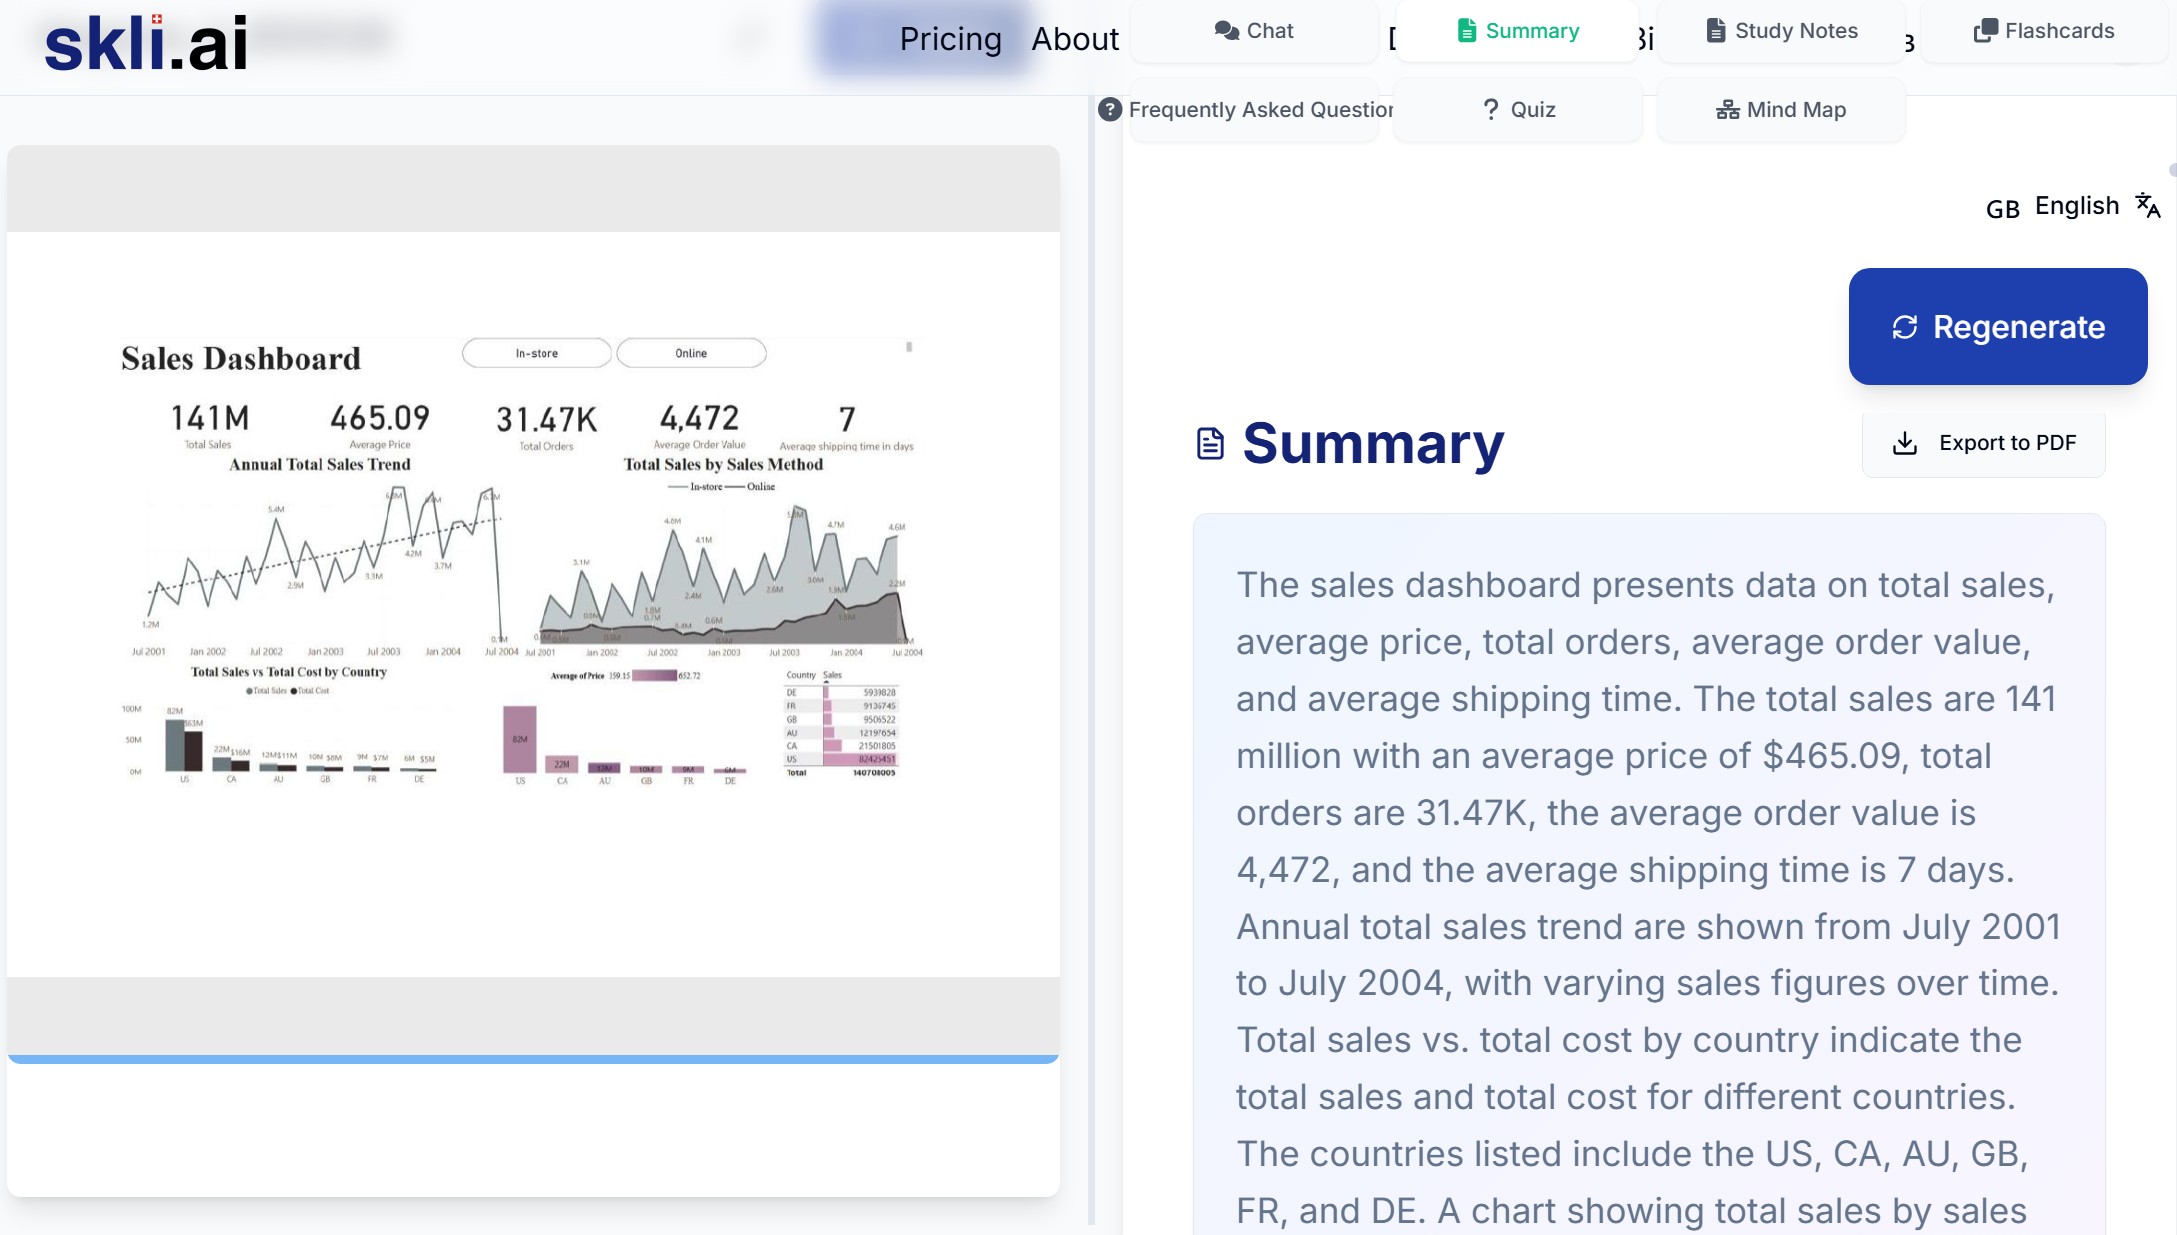
The completed dashboard revealed significant insights:
Sales Volume Variation
- Dashboard: $141M
Channel Performance Analysis confirmed that in-store sales significantly outperformed online channels, indicating potential for e-commerce optimization.
Geographic Distribution Sales performance varied substantially by country, with the US market demonstrating particularly strong performance at over $82M compared to under $10M in several other markets.
Conclusion
This Power BI implementation successfully transformed raw AdventureWorks sales data into an interactive, insight-driven dashboard. The project demonstrates how effective data visualization can support strategic decision-making by highlighting performance patterns across time, sales channels, and geographical markets.
References
- Microsoft. (2024). Power BI Documentation. Microsoft Power BI. https://docs.microsoft.com/en-us/power-bi/
- Sprint 5: Visualizing Data using Power BI. Turing College Learning Materials.
- Knaflic, C. N. (2023). Storytelling with Data: A Data Visualization Guide for Business Professionals. Wiley.
- Ferrari, A., & Russo, M. (2022). Definitive Guide to DAX: Business Intelligence for Microsoft Power BI, SQL Server Analysis Services, and Excel. Microsoft Press.
- Microsoft. (2024). Connect to Google BigQuery in Power BI Desktop. Microsoft Power BI Documentation. https://learn.microsoft.com/en-us/power-bi/connect-data/desktop-connect-bigquery


