Power BI Series at Skli.ai: We don't just provide answers, we build understanding by making complex knowledge digestible and personalized.
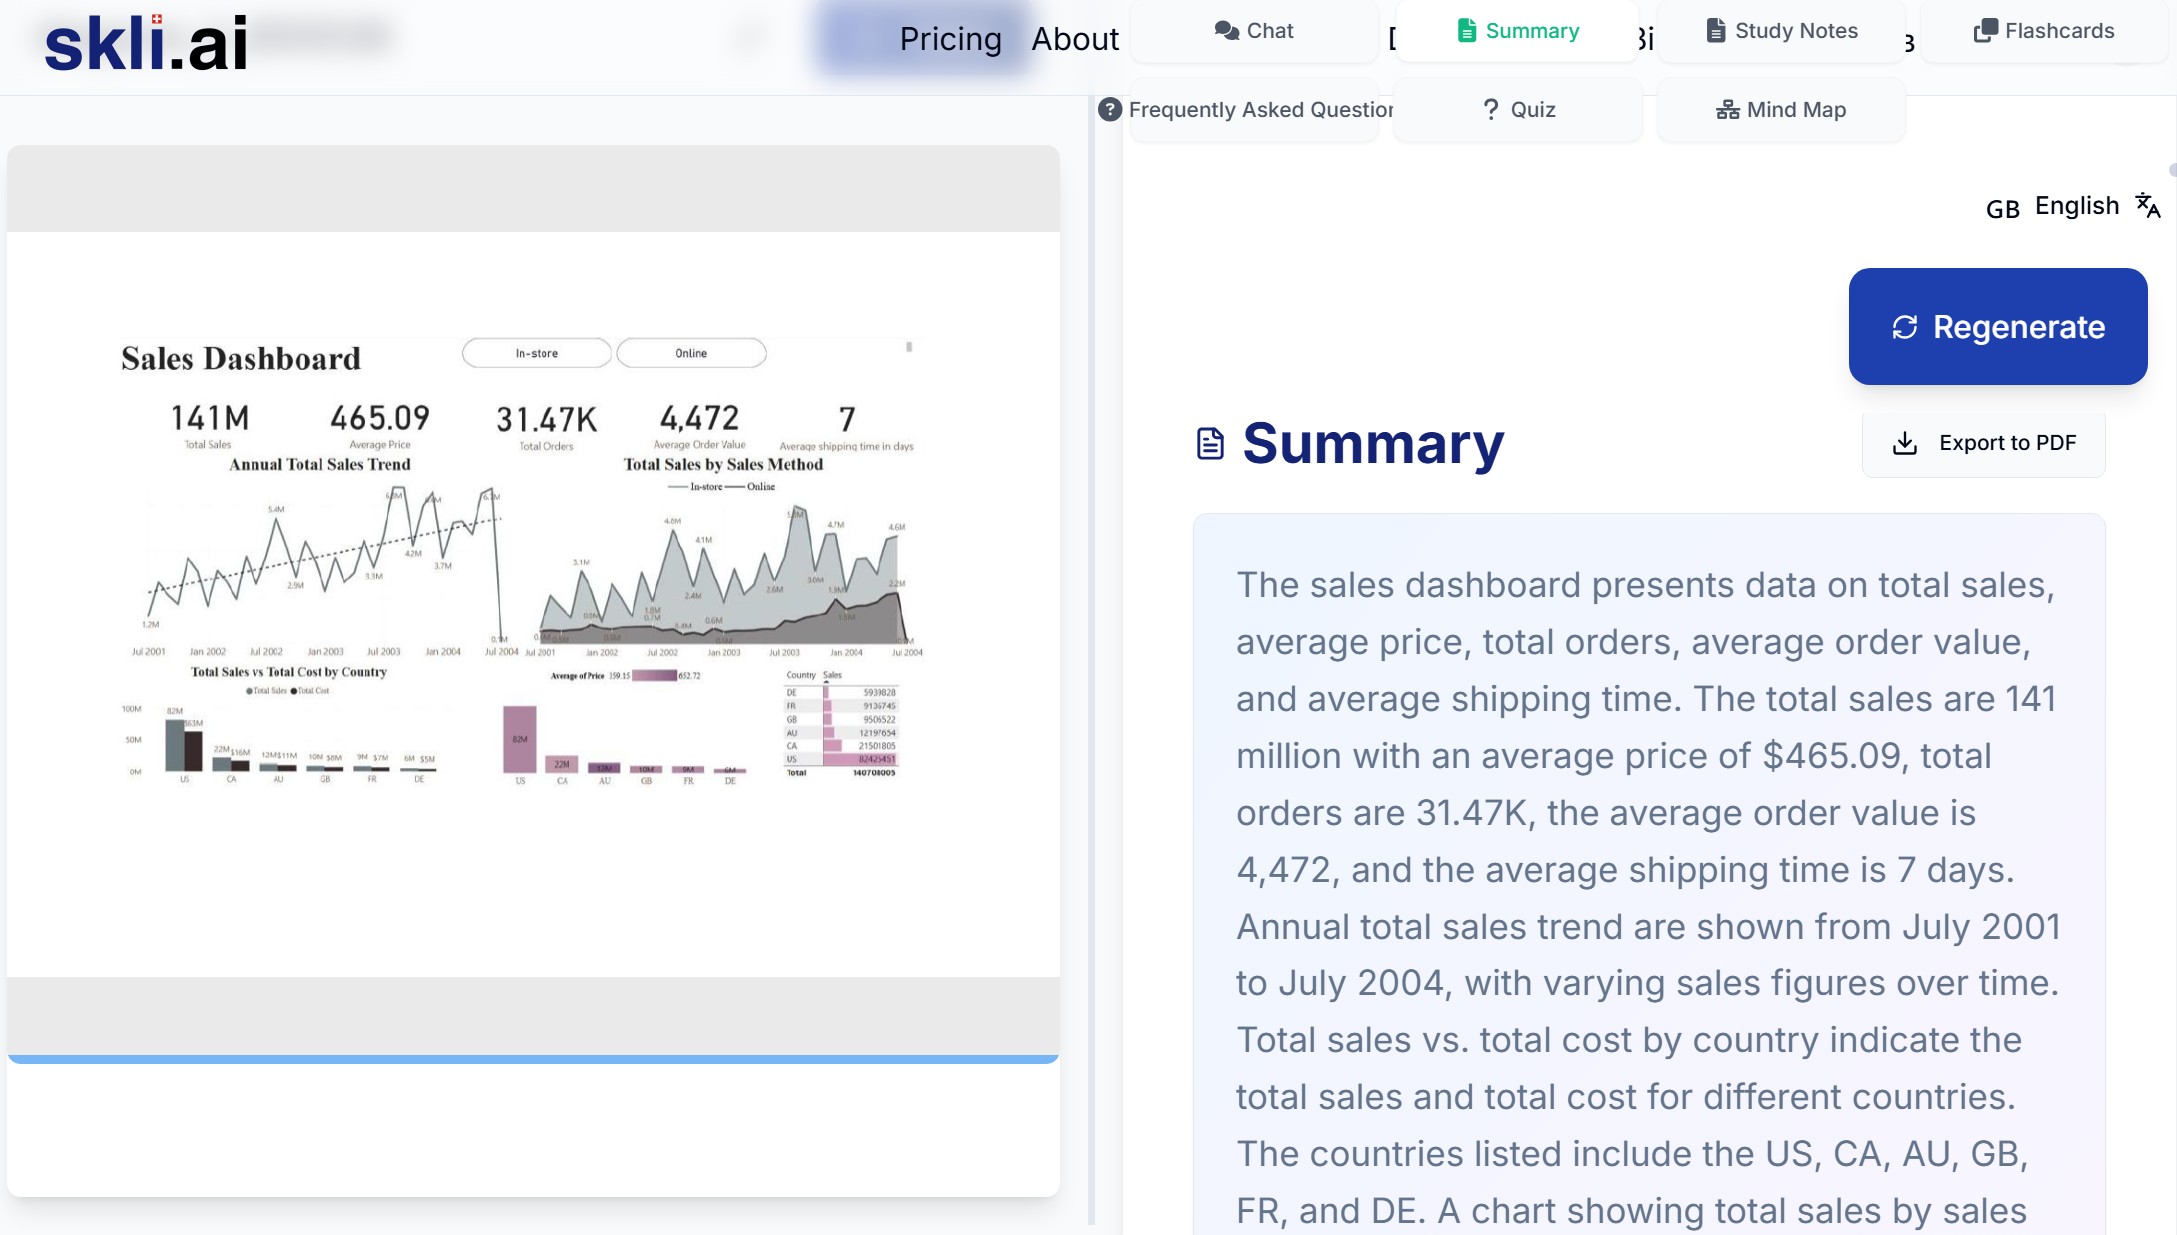
Skli.ai uniquely excels in the Research and Understanding Phase of knowledge work—where other AI systems merely generate content, we specialize in breaking down complex information into structured, comprehensible formats. Our platform transforms uploaded texts and videos into customized learning resources: comprehensive summaries, intuitive mind maps, targeted flashcards, organized learning notes, and relevant study questions.
The data revolution waits for no one. Whether you're pursuing PL-300 certification or strengthening your organization's analytics, this series delivers practical Power BI skills you can apply today. At Skli.ai, we transform complex data concepts into real-world results. Let's dive in.
Introduction
In today's data-driven business environment, organizations need tools that can transform complex datasets into actionable insights. Microsoft Power BI offers a comprehensive solution through a structured visualization hierarchy: reports, dashboards, and tiles. Each component serves a specific purpose in the analytical process, from detailed exploration to high-level monitoring.
This article explores how these three elements work together to create a complete data visualization ecosystem, helping organizations at every level of decision-making.
The Power BI Visualization Hierarchy
Power BI organizes visual content through a structured hierarchy that guides users from granular analysis to executive-level insights:
- Reports: Detailed, multi-page analytical tools for data exploration
- Dashboards: Single-page canvases displaying critical metrics
- Tiles: Individual visualization components that build dashboards
This hierarchy serves different analytical needs across the organization:
- Strategic Overview: Dashboards provide executives with at-a-glance views of performance
- Tactical Analysis: Reports enable analysts to explore relationships and trends in detail
- Specific Metrics: Tiles focus attention on individual KPIs and data points
Power BI Reports: Deep Analytical Exploration
Power BI reports are multi-page visualizations designed for interactive exploration and in-depth analysis. They're the foundation of the Power BI ecosystem, providing a robust interface for uncovering insights from complex datasets.
Key Characteristics of Power BI Reports:
- Multi-Page Structure: Reports can contain multiple pages, each focused on a specific aspect of the data, creating a structured analytical narrative
- Interactive Analysis: Users can slice, filter, highlight, and drill down into the data for detailed exploration
- Single Dataset: Each report connects to one dataset, though that dataset may contain multiple tables and relationships
- Creation Environment: Designed primarily in Power BI Desktop, offering extensive development capabilities
- Visualization Variety: Reports leverage numerous visualization types like charts, maps, tables, matrices, to translate raw data into meaningful visual formats
Reports excel when you need to conduct deep-dive analysis, explore complex datasets with multiple relationships, enable interactive data exploration, or create data-driven narratives.
Power BI Dashboards: The Strategic Overview
While reports focus on detailed analysis, dashboards provide a high-level summary of the most important information tracked by your organization. They're single-page canvases that bring together key visualizations from various reports and datasets.
Key Characteristics of Power BI Dashboards:
- Single-Page Focus: Dashboards are designed to provide a concise overview on a single screen
- Aggregation from Multiple Sources: They can pull data from different reports and datasets across workspaces
- Limited Interactivity: While visualizations are somewhat interactive, dashboards offer less filtering capability than reports
- Alerts and Notifications: Dashboards can trigger alerts when metrics cross predefined thresholds
- Sharing Emphasis: They're optimized for collaboration and distribution to stakeholders
Dashboards serve as strategic monitoring tools, providing quick insights across multiple data domains in a unified view.
Power BI Tiles: The Building Blocks
Tiles are the individual components that make up a dashboard—the fundamental building blocks of the visualization hierarchy. Each tile represents a specific visualization pinned from a report.
Key Characteristics of Power BI Tiles:
- Data Snapshots: Each tile captures a visualization at a point in time, updating when the underlying data refreshes
- Visual Representation: Tiles present data in visually appealing, easily digestible formats
- Source Connection: Clicking a tile typically navigates to the source report for deeper analysis
- Customization Options: Size, position, titles, and subtitles can be adjusted to create cohesive dashboards
- Variety of Content: Tiles can display visualizations, text boxes, images, videos, or streaming data
The relationship between dashboards and tiles resembles a car's control panel (the dashboard) and its individual gauges (the tiles)—each component contributes specific information to create a comprehensive monitoring system.
Choosing the Right Visualization Component
Understanding the differences between reports, dashboards, and tiles helps organizations structure their Power BI content effectively:
| Feature | Reports | Dashboards | Tiles |
| Purpose | Detailed analysis and exploration | High-level monitoring | Individual metric focus |
| Structure | Multi-page format | Single-page display | Individual component |
| Audience | Analysts and decision-makers | Executives and monitors | Part of dashboard experience |
| Interactivity | High (filtering, drill-through) | Limited (navigation to reports) | Minimal (opens source report) |
| Data Source | Single dataset per report | Multiple reports / datasets | Single visualization |
| Creation | Built in Power BI Desktop | Assembled in Power BI Service | Created in reports, pinned to dashboards |
Practical Application: The Analytical Journey
To illustrate how these components work together, consider this practical example:
- Data Analysis Phase: An analyst creates a multi-page sales performance report in Power BI Desktop, with detailed visualizations exploring regional trends, product performance, and customer segments.
- Insight Identification: After identifying key insights, the analyst pins the most important visualizations (top-performing regions, sales trends, critical KPIs) to a dashboard.
- Executive Monitoring: Executives now have a single-page dashboard showing critical metrics, with each tile providing a snapshot of an important business aspect.
- Detailed Exploration: When an executive notices an anomaly in the sales trend tile, they click it and navigate to the source report for deeper analysis.
This workflow demonstrates how reports, dashboards, and tiles create a complete analytical ecosystem—from detailed exploration to high-level monitoring and back again.
Conclusion
Power BI's visualization hierarchy of reports, dashboards, and tiles provides a structured approach to data analysis and presentation. By understanding the unique characteristics and purposes of each component, organizations can effectively design their Power BI environment to support multiple decision-making levels:
- Reports for detailed analytical exploration
- Dashboards for strategic oversight
- Tiles for focused metric monitoring
Together, these components create a comprehensive data visualization system that transforms complex data into accessible insights, enabling data-driven decision-making across the organization.
References
Microsoft. (2024). Power BI Documentation. https://learn.microsoft.com/en-us/power-bi/
Microsoft. (2024). Exam PL-300: Microsoft Power BI Data Analyst. https://learn.microsoft.com/en-us/certifications/exams/pl-300/


