Blog
Entdecken Sie die neuesten Tipps, Einblicke und Updates von unserem Team.
Power BI Visualization : Understanding Reports, Dashboards, and Tiles
Discover how Power BI's three-tiered visualization hierarchy—reports, dashboards, and tiles—creates a complete analytical ecosystem for your organization. Reports provide deep, interactive analysis for data exploration; dashboards offer strategic, at-a-glance views of key metrics; and tiles serve as the fundamental building blocks that bring focused insights to life. Learn how these components work together to transform complex data into actionable insights at every level of decision-making.
DirectQuery: Real-Time Data Access in Power BI
What makes DirectQuery particularly valuable in the modern analytics landscape is its alignment with evolving data practices. As organizations increasingly implement data lakes, data warehouses, and other centralized repositories with their own query processing capabilities, DirectQuery provides a natural interface that respects and extends these investments. Rather than creating isolated analytics silos, it promotes a cohesive enterprise data architecture where source systems and analytics tools work in harmony. The decision between DirectQuery and Import mode transcends simple technical comparison—it reflects an organization's broader data strategy. Organizations that prioritize real-time decision making, have invested heavily in source system optimization, and manage massive datasets that change frequently will find DirectQuery aligned with their needs.Conversely, those prioritizing consistent performance, complex calculations, and offline access may find Import mode more suitable.
Power BI Visualization : Understanding Reports, Dashboards, and Tiles
Discover the essential components of Power BI visualization in this comprehensive guide. Learn how reports, dashboards, and tiles work together to transform your data into actionable insights. This guide covers fundamental concepts, best practices, and practical examples to help you create effective visualizations that drive better business decisions
Building Interactive Sales Dashboards in Power BI: A Step-by-Step Project Guide with DAX Formulas
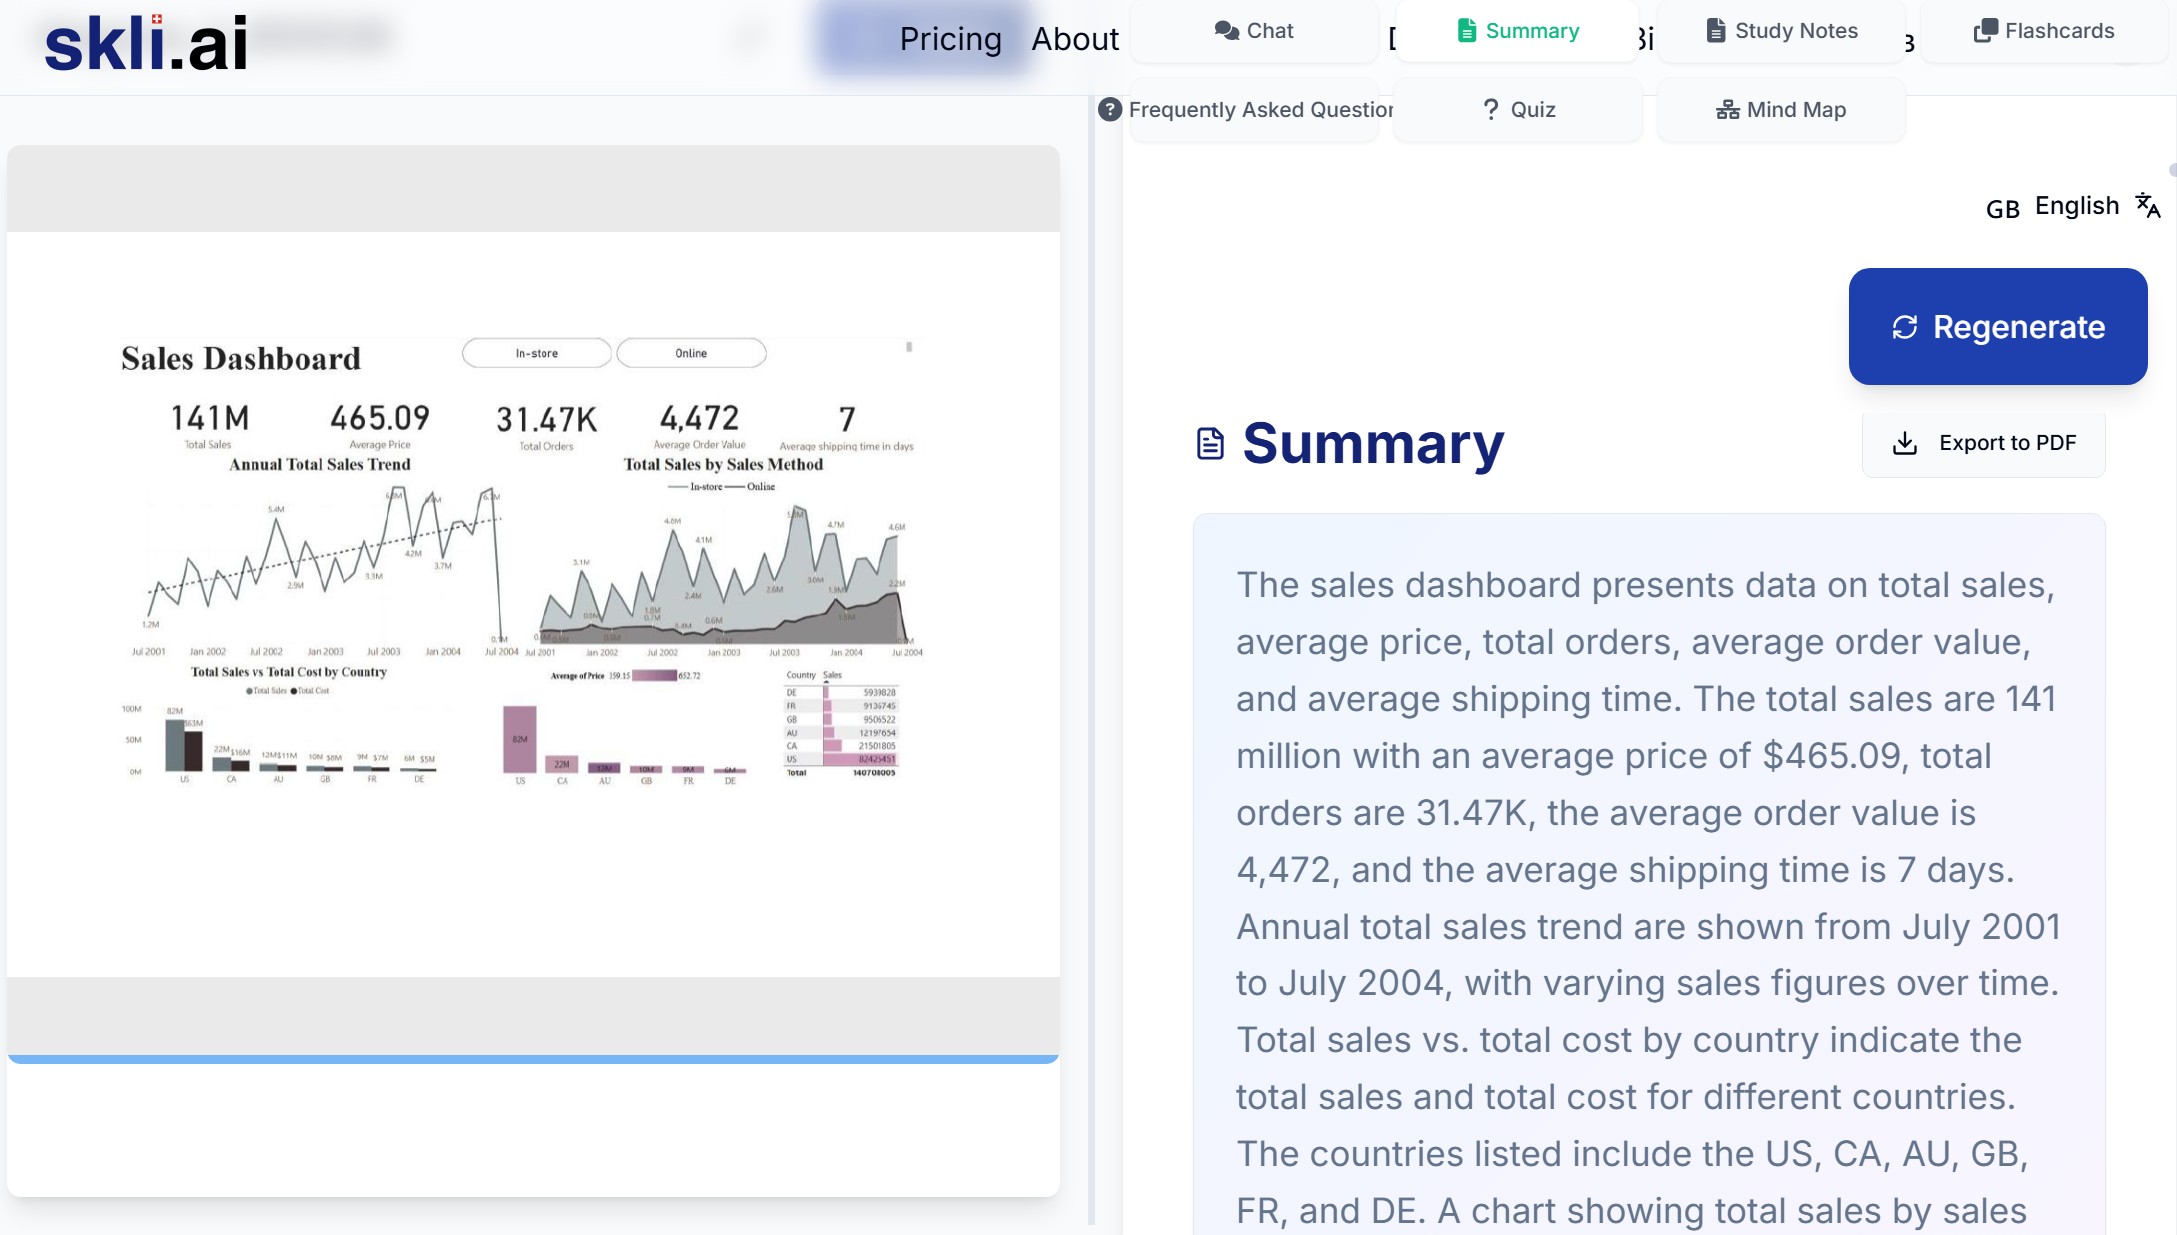
This report showcases the development of an interactive sales dashboard for AdventureWorks using Microsoft Power BI. By transforming raw sales data into dynamic visualizations, the dashboard provides the Sales Director with actionable insights across different channels and markets. The project involved connecting to Google BigQuery, writing targeted SQL queries, and implementing DAX formulas for key metrics. Key performance indicators include Orders Count, Total Sales, Average Order Value, and Average Days to Ship, all prominently displayed for immediate visibility. The most significant finding revealed that in-store sales substantially outperformed online channels, while geographic analysis identified the US as the strongest market with over $82M in sales compared to under $10M in several other regions. This Power BI implementation demonstrates how effective data visualization supports strategic decision-making by highlighting performance patterns across time, sales channels, and geographical markets
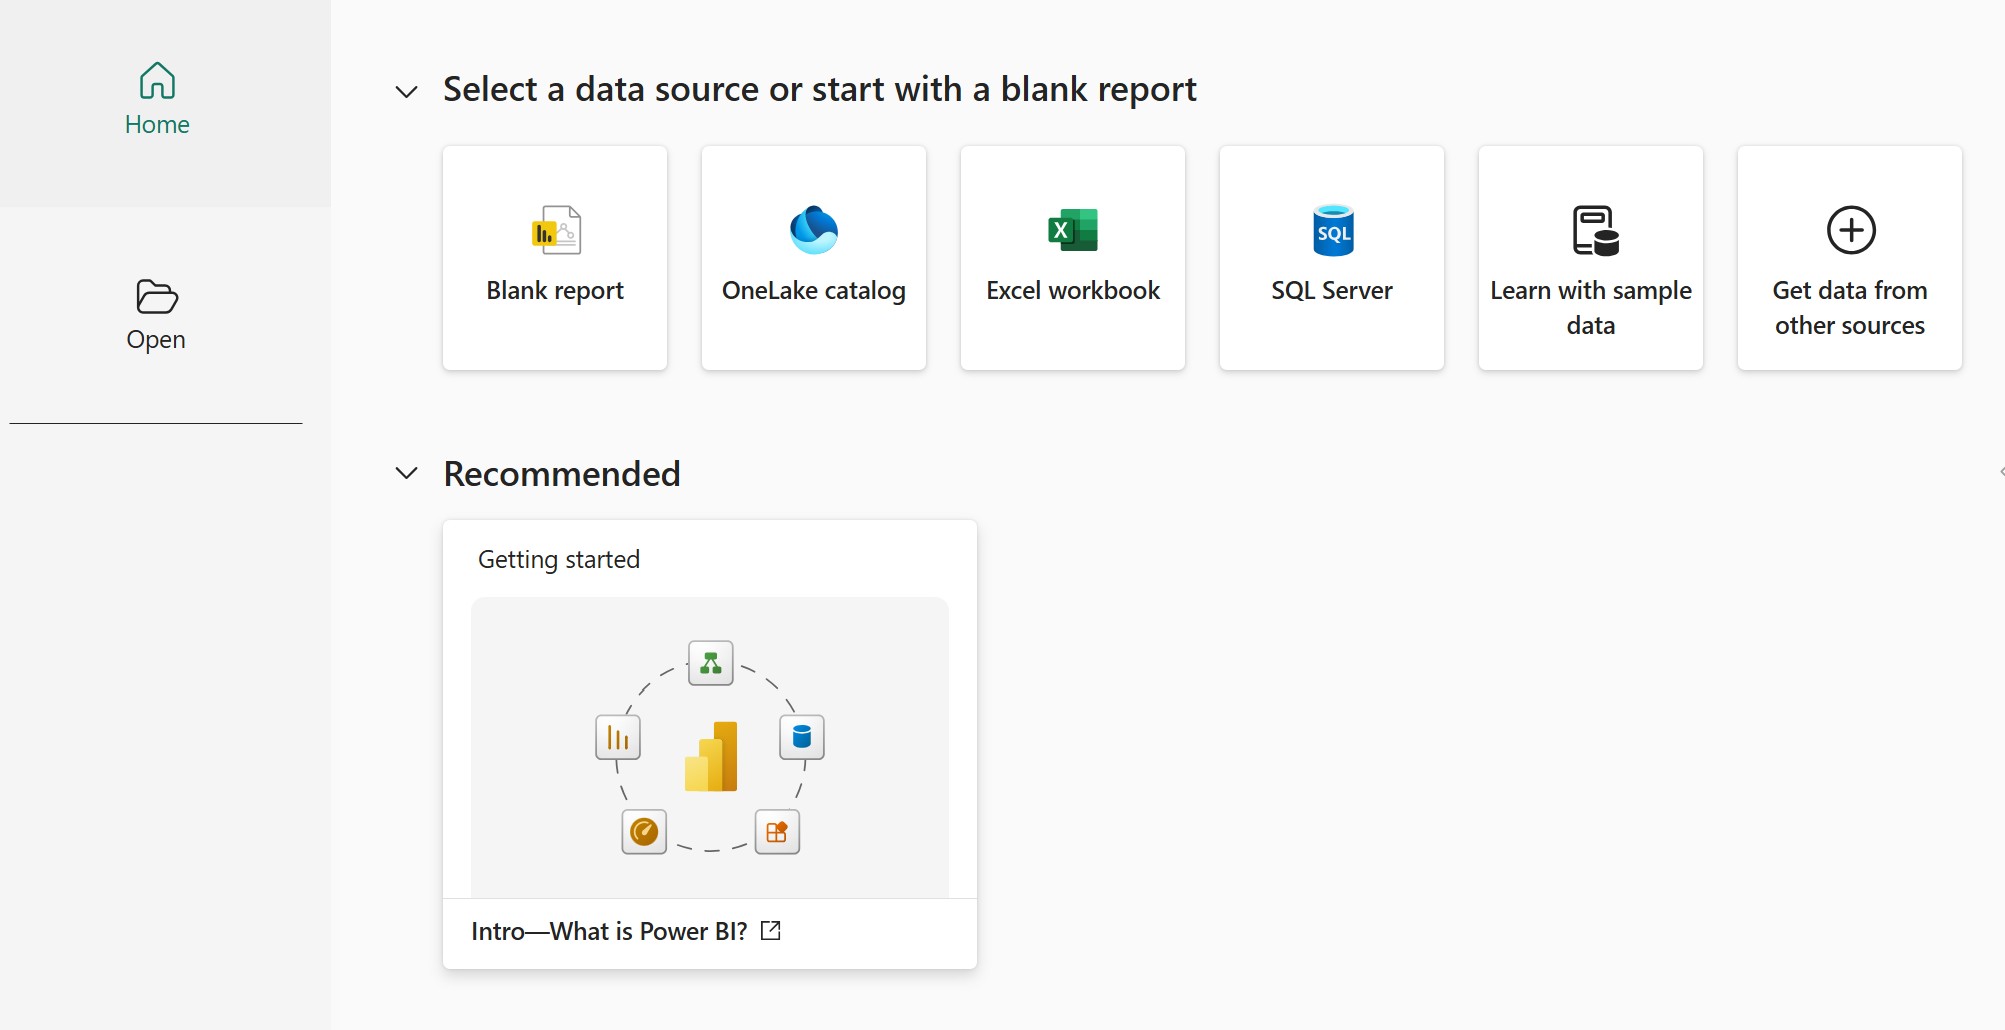
Power BI DAX Functions: The Ultimate Guide to Data Analysis Formulas
Mastering DAX functions is essential for unleashing the full analytical power of Power BI. By understanding and applying aggregation, conditional, filtering, and date/time functions, you can create sophisticated calculations that transform raw data into valuable business insights. Remember that context is king in DAX, and the best way to become proficient is through practice. Start with simple measures and gradually build up to more complex calculations as you become more comfortable with the language.With these essential DAX functions in your toolkit, you'll be well-equipped to tackle even the most challenging data analysis scenarios in Power BI.
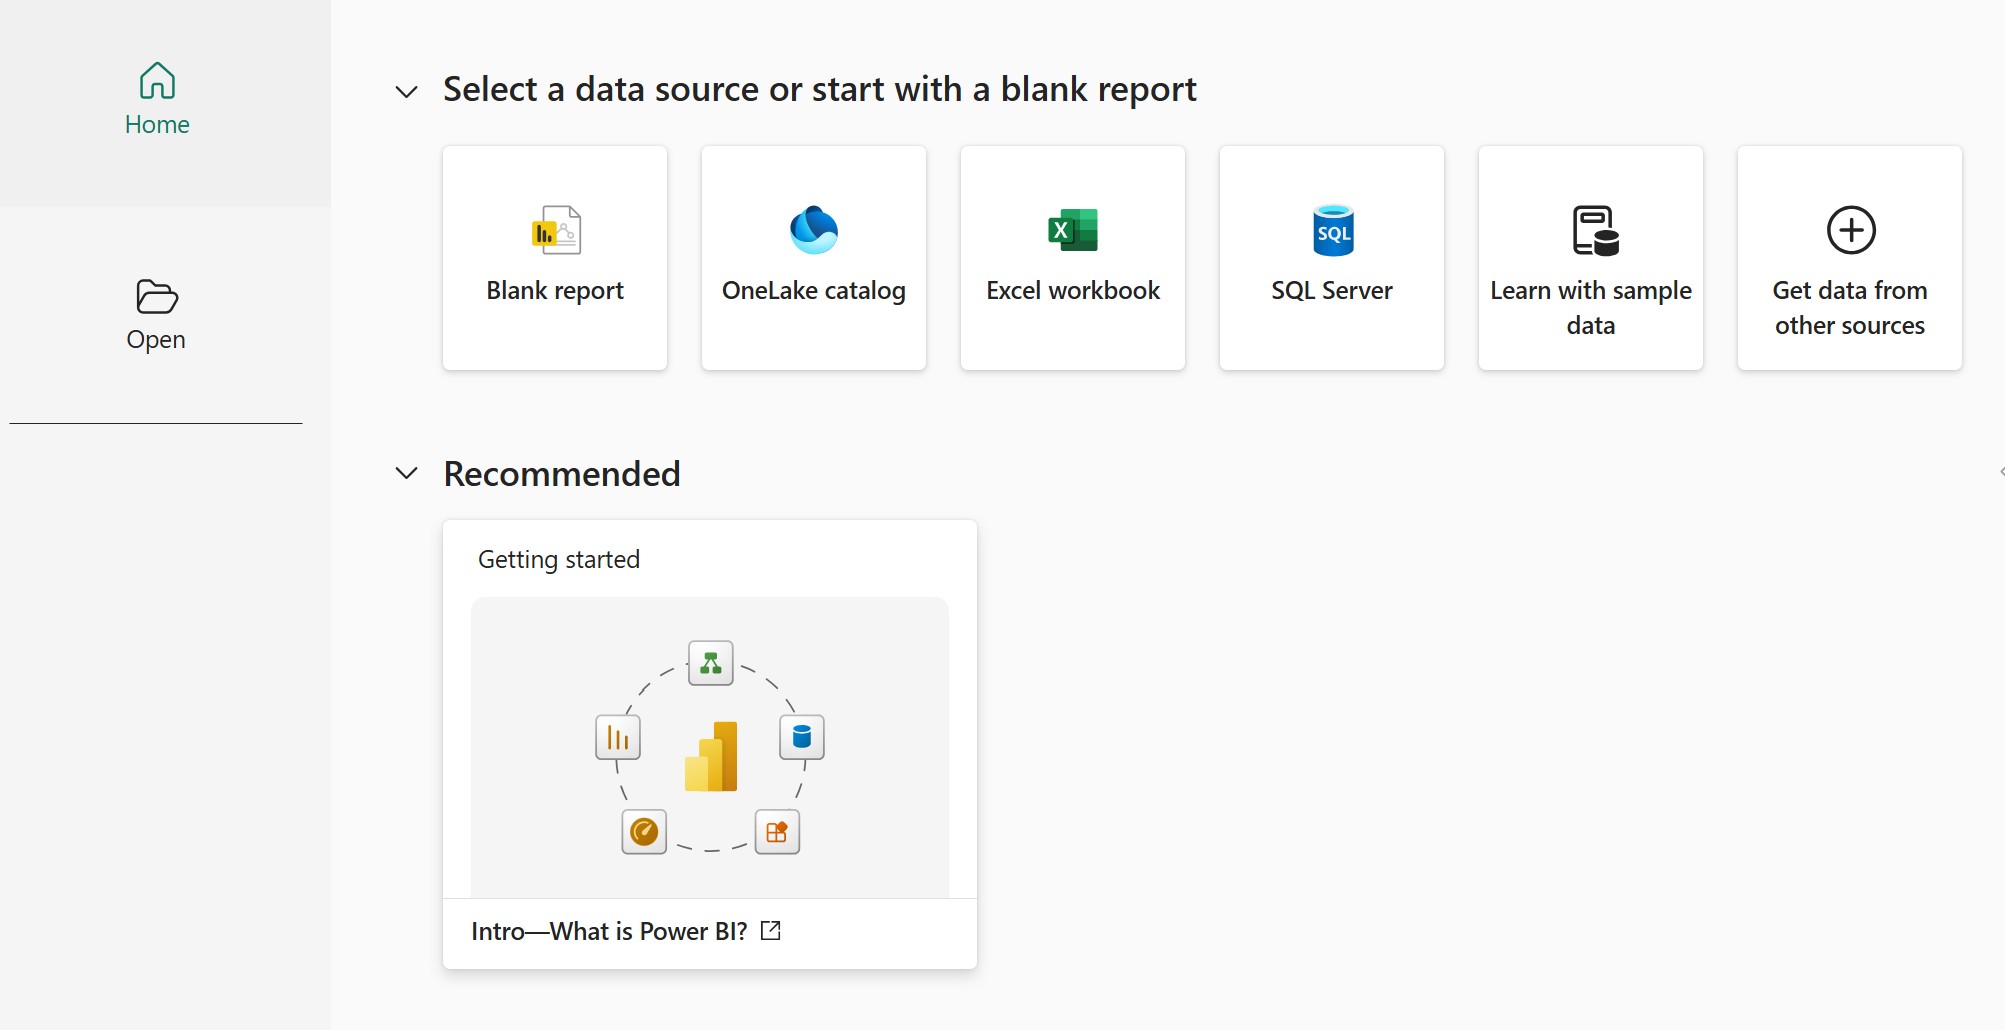
Power Query and DAX: The Unified Data Pipeline for Transformation and Analysis
For organizations committed to data-driven decision making, mastering both Power Query and DAX provides compounding returns. Investments in better data preparation through Power Query yield more reliable inputs for DAX calculations, while sophisticated DAX formulas extract greater value from well-prepared data. This virtuous cycle transforms data from a static resource into a dynamic asset that continuously delivers organizational insights. As business data continues to grow in volume and complexity, the Power Query and DAX pipeline offers a scalable, adaptable approach to analytics that will remain relevant regardless of specific business domains or data sources. By understanding and leveraging these complementary technologies, organizations can build a sustainable analytics foundation that evolves with changing business needs while continuing to deliver consistent, trustworthy insights that drive informed decision-making.
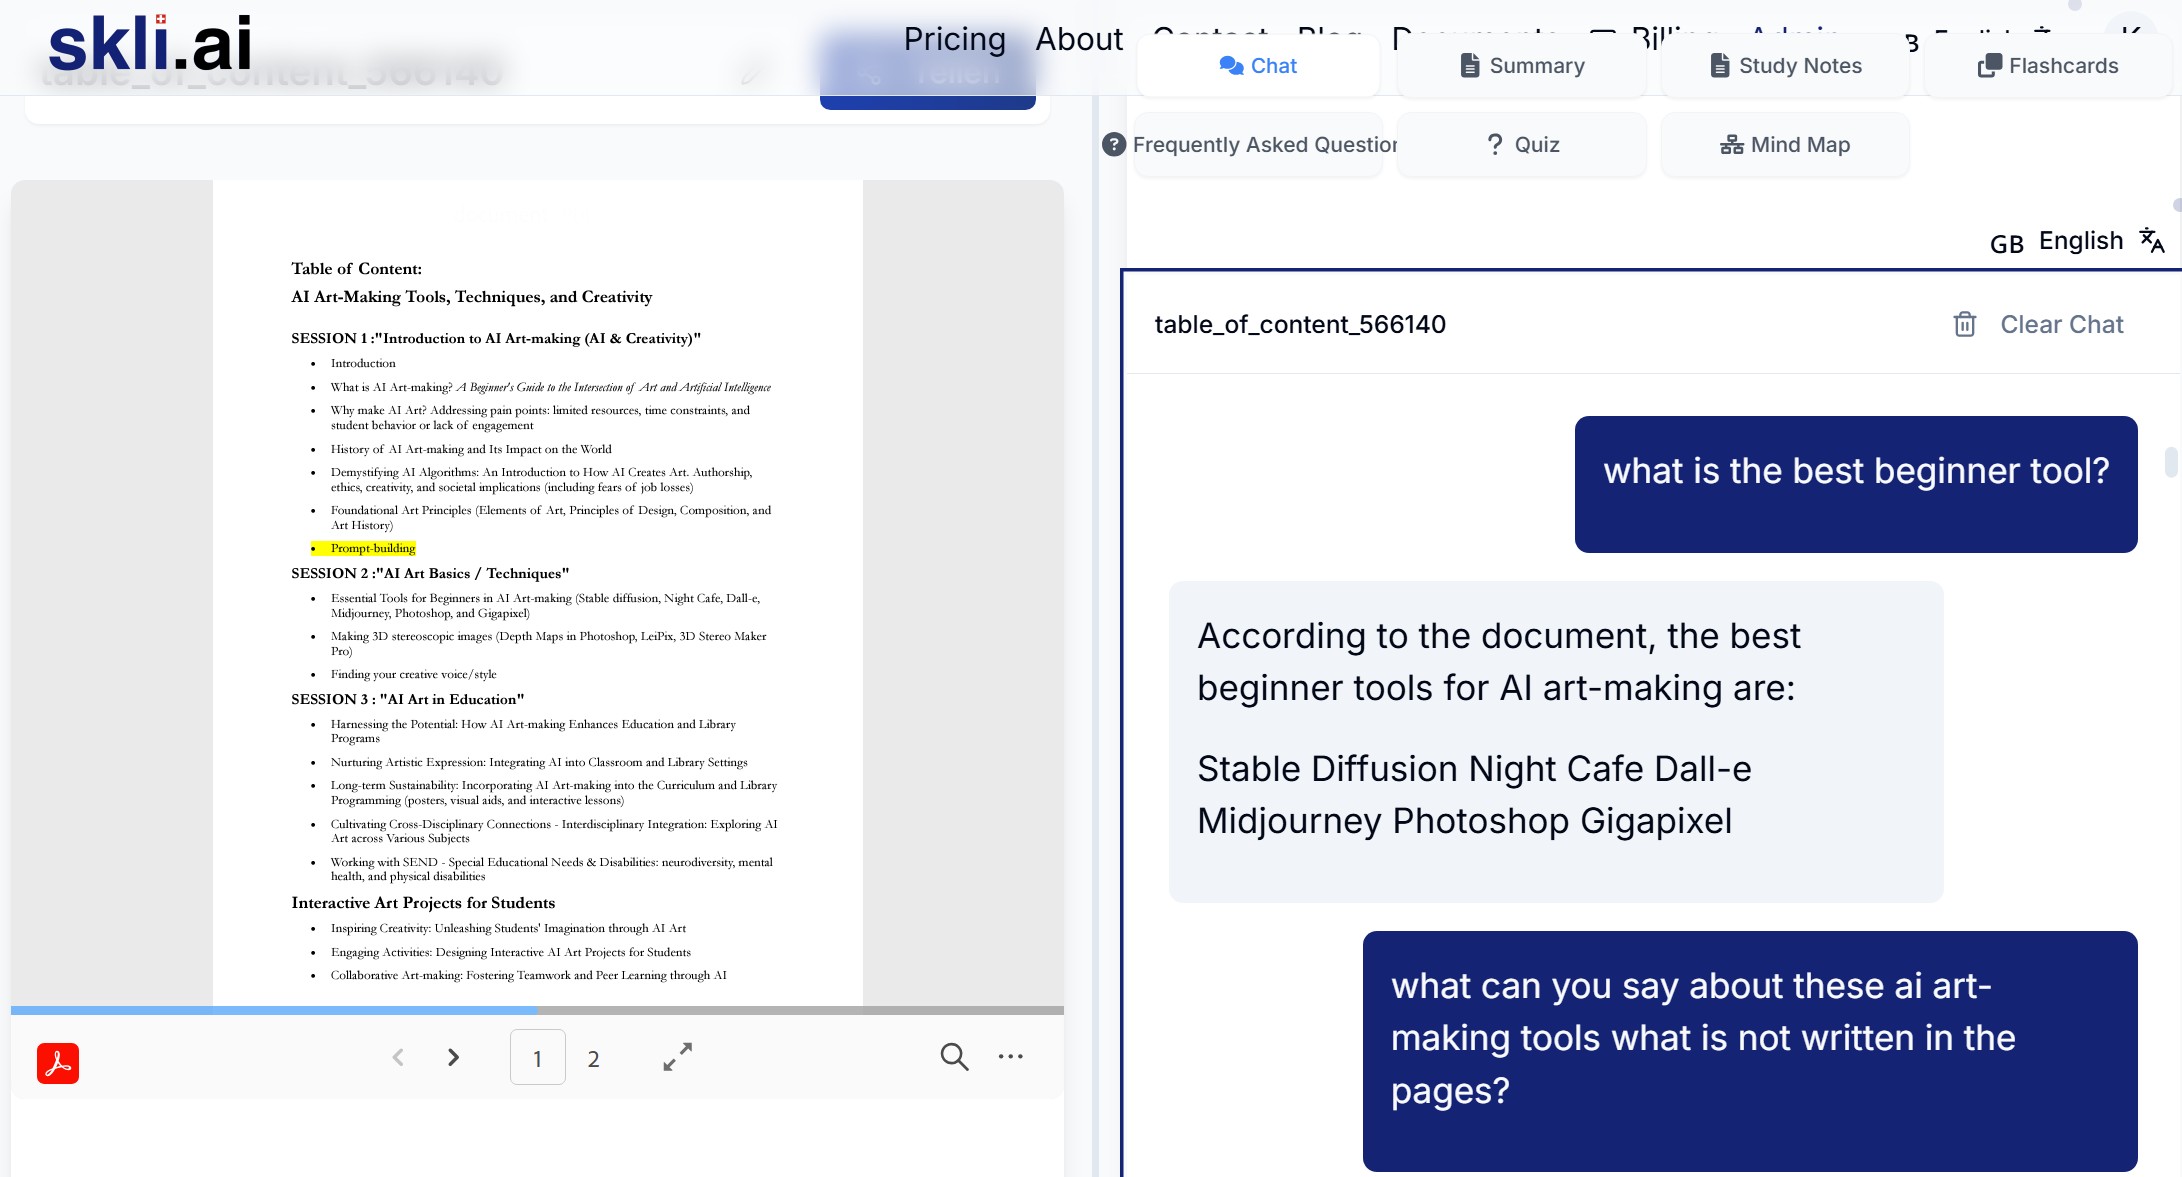
Cross-Curricular AI Art Projects: How Skli.ai Bridges Disciplines Through Creative Exploration And Crafts Transformative AI Prompts
In the evolving landscape of educational technology, the ability to communicate effectively with AI has become a critical skill. Skli.ai introduces a revolutionary approach to learning through intelligent prompt engineering – a method that transforms complex ideas into accessible, engaging educational experiences. At the heart of this approach lies a simple yet powerful concept: the right prompt can unlock unprecedented learning potential. Whether you're a student exploring creative arts, an educator designing curriculum, or a professional seeking skill development, mastering the art of prompt crafting is key to harnessing the full power of AI-assisted learning. The magic happens in the details – in crafting prompts that are specific, creative, and purpose-driven. From explaining complex AI concepts through a child's magical paintbrush to designing cross-disciplinary learning experiences, effective prompts are the bridge between human curiosity and artificial intelligence's vast knowledge.
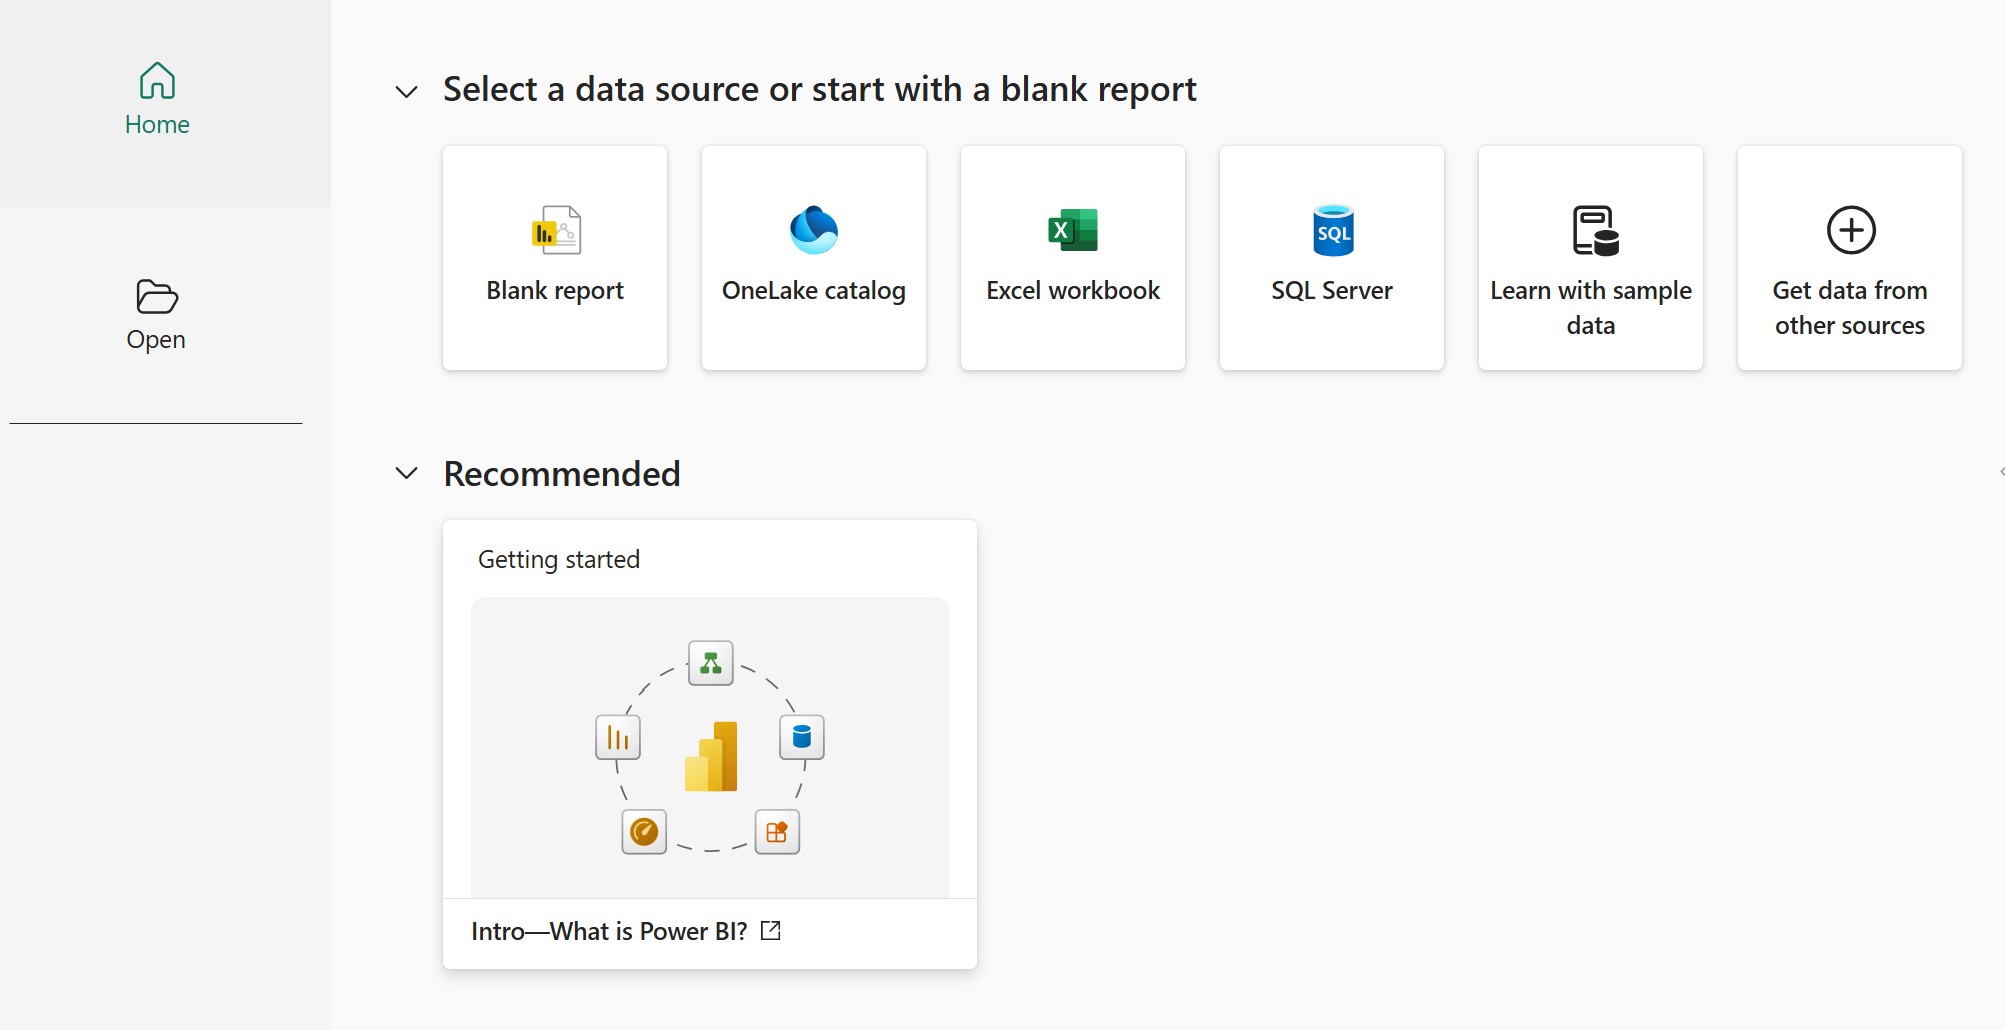
Power BI Service: Cloud Platform for Enterprise Analytics
What distinguishes the Power BI Service is its elegant balance between democratization and governance. By creating a centralized platform where insights can be securely shared yet appropriately controlled, organizations can simultaneously empower business users with self-service analytics while maintaining the data integrity and security that enterprise operations demand. This resolves the traditional tension between agility and control that has challenged business intelligence implementations for decades. The workspace-based collaboration model fundamentally changes how teams interact with analytics assets. Instead of isolated analysis trapped in individual computers, the Power BI Service creates living, evolving intelligence ecosystems where teams collectively refine and enhance organizational knowledge. These collaborative environments transform analytics from static reports into dynamic conversations about business performance and opportunities. Perhaps most significantly, the automated data refresh capabilities shift the paradigm from point-in-time analysis to continuous intelligence. By maintaining connections to source systems and refreshing data on scheduled intervals, the Power BI Service ensures that decision-makers always have access to current information without manual intervention. This automation not only increases efficiency but also dramatically improves the reliability and timeliness of business insights.
Master 13 Essential AI Tools with Skli.ai
In today's AI-powered world, dozens of specialized tools help us create content, analyze data, and automate tasks. But which tool helps us actually learn? This is where Skli.ai makes its unique contribution to the AI ecosystem. While tools like Midjourney generate stunning visuals and Copy.ai crafts marketing content, Skli.ai serves as the critical integration layer that helps users learn effectively across this diverse landscape. Our knowledge synthesis technology distills complex topics from multiple sources, identifies key relationships between ideas, and presents information in formats optimized for different learning styles.
